Slave Records 1822 – 1834
After Emancipation in Britain the British Government saw the need to find out the number of slaves held in all British ruled territory overseas.
Following the Registration Act of 1821 it became a requirement for all slave owners to provide a basic return every three years. In the Turks and Caicos Islands this began in 1822. The Information recorded included the slave owner’s name and island of abode (not necessarily the same as where they employed the slaves), the agent acting on behalf of the slave owner if the owner was not present and the slave’s name and age. The slave names recorded are usually biblical (Rachel, Sarah, Jacob, etc), job related (such as Mariner) or color related (Darky). The ages are also clearly rounded up or down as no proper records seem to have been kept. From 1822 a record was also kept of the changes of the slaves held, which recorded all new slaves acquired through purchase, birth, bequest etc. and all slaves lost through sale, transfer to another country, runaway, emancipated or death. This allows an idea of the movement of the slaves between estates as well as birth and mortality rates.
| Slave records and number of slave holdings, 1822-1834 | |||||
| Year | 1822 | 1825 | 1828 | 1831 | 1834 |
| Number of slaves recorded | 1912 | 1457 | 1397 | 1436 | 1384 |
| Number of slave holdings | 188 | 190 | 173 | 165 | 15 |
However, these records do have a problem. It is clear that some slaves are being counted/recorded twice: for 1822 there are at least 22 slaves recorded twice, and in 1828 there are 23. It is almost certain that not all slaves were being counted, for example towards the end there are slaves being owned in 1831 but there are no returns from the slave owners in 1834, which there should be if they were supposed to record the changes in slave holdings from 1831 to 1834. There is also no apparent reason why there are so many more slaves recorded in 1822 than in the following 4 records, unless we conclude that the death of Wade Stubbs in 1822 saw many of his slaves being freed, running away or being sold to people outside the country and it is this that partly accounts for the dramatic decline from 1822 and 1825 (although many of his slaves were purchased by Henshall Stubbs and taken to Grand Turk). However, It is clear by the steady numbers from 1825 that around 1400 slaves was the required number to maintain the economic activity of the Turks and Caicos Islands.
Again, there is difficulty in counting the number of slave owners. The numbers above are for the holdings rather than individuals. In some instances a group of slaves would be owned by several family members, and in other cases the same slave owner is recorded twice, either duplication of a record or with different slaves. Also, where the entry records no slaves these owners have been excluded.
The records held in 1834 are the most comprehensive for slave information as more details were required in preparation for emancipation. Now there was an additional entry referring to the slave’s occupation. It is also clear that some slave owners are carrying out speculation, by buying up slaves just prior to 1834 hoping that the compensation to be paid for each slave by the British government would exceed the money paid by the slave owners.
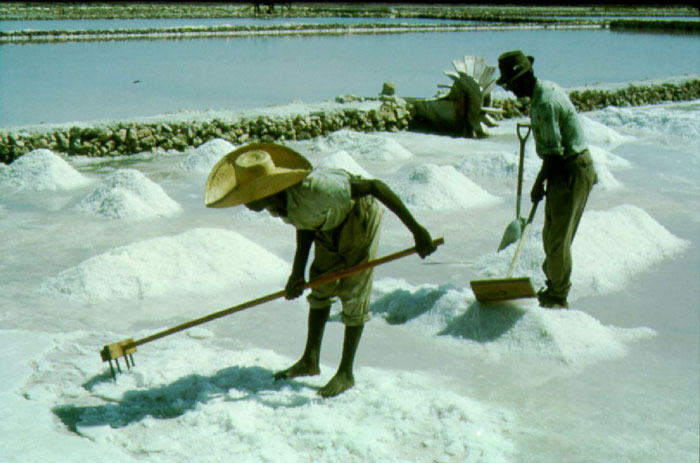
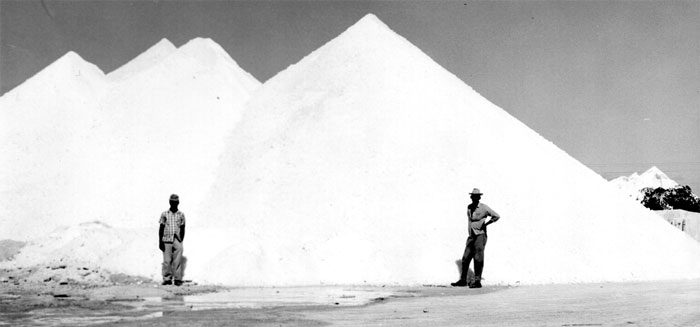
Saunders (1985) looks into the slave records for the Bahamas (including the Turks and Caicos) in more detail. Her published analysis gives useful statistics but in many cases hides the Turks and Caicos figures within general statistics for the area. The Turks and Caicos Islands appear to be slightly different to the rest of the Bahamas, probably because of the salt industry. In the Turks and Caicos Islands it is estimated that in 1834, 48.26% were employed in the salt industry (Saunders, 1985, p122). However, the data of occupation of the slaves in the 1834 register is perhaps misleading. The main occupation would be given, such as salt raker, but it must be remembered that for certain times of the year salt would not have been collected: the likelihood of rain was such that it was not practical to start the process. This would mean that for several months of the year salt could not be raked. Slaves could still have been used to repair the salt pond walls but it is more likely that they would have been employed in another task, such as fishing. According to Saunders (1985, p123) the working practice would depend on sex and age. A young female was more likely to be employed as a nurse or domestic staff whilst a young male would almost certainly be employed in the salt ponds. As women got older they were more likely to be employed in the salt industry, whereas the men, when they got older were more likely to change occupation, as the salt industry would have taken its toll on them.
To support the salt workers in 1834 31% of slaves were employed as domestics and 5% as tradesmen. 20% worked agricultural labour, mostly in the Caicos Islands (Saunders, 1985, p129). In fact 24% of the slave population consisted of children under the age of 10, who would generally be employed in lighter duties and domestic labour. Also salt workers were more likely to be black rather than Mulatto, probably as they were considered to be stronger.
The 1834 statistics can also indicate health. There were 565 (80.9) “effective” males and 530 (78.17%) “effective” females making a total “effective population of 1095 (79.6%). There were 133 (19.1%) “non-effective” males and 148 (21.83%) “non-effective” females. Making a total “non – effective” population of 281 (20.4%). These statistics only record those who would have been able to work and not those who were too young (17.44% of the total slave population), those who were too old (1.74% or those “diseased (2%) (Saunders, 1985, p137 and 140). It is in fact likely that medical provision was limited and very basic: there may have been an occasional visiting doctor. It was therefore left up to the residents to make their own provisions. “Bush Medicine” is still practiced on some of the Islands and it is clear that this knowledge has been passed down through families from the time of slavery. It is also likely that plants such as Aloe Vera were imported specifically for the slaves for their medicinal uses.
In 1834 13.08 % (180 individuals) of slaves on the Turks and Caicos Islands were Mulattos, a mixture between black and white (Saunders, 1985, p107). 112 of these were under 20 years of age. This should not be that surprising as the slaves lived in close proximity to the slave owners and their would certainly have been some fraternisation (wanted or unwanted in the case of the slave), especially between the male owners and female slaves. Saunders research into the Slave records show that there were equal numbers of male and female slaves in the Bahamas, (at first glance it appears that there are slightly more males than females in the Turks and Caicos) and suggests that the majority of the Bahamian slaves lived in nuclear families. These family units, if they did exist, was probably one of the reasons why there was no real rebellion and low risk of runaways: slaves would not risk losing the family ties or put the other family members at risk of repercussions for their escaping.
Saunders shows that between 1825 and 1834 there was a steady growth in the birth rate in the Turks and Caicos Islands. However, there was also a high child mortality rate.
1822-24 1825-27 1828-31 1831-34
26.17 26.93 15.48 21.61
Table 2: Death rates per 1000 per year for Turks and Caicos slave population (Saunders, 1985, p64)
According to Saunders, females were twice more likely to be manumitted than males in the Turks Islands. However, the highest ratio of slaves to be manumitted in the Turks and Caicos Islands were the under 9 age category, and Saunders (P69) felt that many of these had been fathered by the transient Bermudan salt pond owners.
The Turks and Caicos National Museum has also been carrying out research on the 1822-1834 records held at the Public Record Office, England. The following tables follow the preliminary data collecting.
Year Slave Number Owner
1822 384 Wade Stubbs
1825 99 Henshall Stubbs
1828 143 Henshall Stubbs
1831 173 Henshall Stubbs
1834 192 Henshall Stubbs
Table 3: Largest Slave holdings, 1822-1834
1-5 6-10 11-20 21-30 31-40 41-50 51-100 101-150 151-200 200+
1822 111 34 26 9 2 1 3 1 0 1
1825 127 24 24 7 1 3 3 1 0 0
1828 116 21 24 4 1 3 4 1 0 0
1831 110 22 19 4 2 2 5 0 1 0
1834 98 21 14 8 6 0 3 0 1 0
Table 4: Number of slave holdings by size. (Note : Saunders (p 95) records 91 slaves holdings of between 1 and 5 slaves in 1834, compared to 98. This discrepancy needs to be investigated further.)
Year No. of Holdings Holdings of1 slave Holdings of 1-5 slaves
of 1 slave % of total % of total holdings
1822 45 24% 59%
1825 61 32% 67%
1828 57 33% 67%
1831 45 27% 67%
1834 39 26% 65%
Table 5: Number of Holdings of 5 or less slaves.
Generally, between one quarter to one third of all slave holdings consisted of only one slave, while nearly two thirds consisted of 5 or less slaves.
Year 1822 1825 1828 1831 1834
Average Slave Holding 10.2 7.7 8.1 8.7 9.2
Table 6: Average number of slaves in each holding
These records give a tantalizing insight into the slaves; yet clearly stop well short of being able to be used to give a real “history” of the slaves, their lives, their hardships and their thoughts.
